ESG Performance Dashboards: Integrating Circular Solutions into Infrastructure Analytics
The transition from traditional project monitoring to a comprehensive ESG Performance Dashboard is no longer a luxury but a strategic necessity for modern infrastructure. At TerraMi, we recognize that measuring what really matters requires a shift from static reporting to dynamic, real-time data integration that aligns with global Sustainability Goals. By embedding Circular Solutions into the core of these analytics, project managers can move beyond mere compliance to achieve true operational excellence. This thought leadership piece explores how data-driven dashboards serve as the “single source of truth” for investors and stakeholders, ensuring that every metric tracked is an actionable step toward a net-zero future.

The Evolution of the ESG Performance Dashboard
In the past, infrastructure reporting was often retrospective, focusing on annual safety records or energy bills. Today, a sophisticated ESG Performance Dashboard must be forward-looking. It acts as a bridge between high-level corporate commitments and on-the-ground reality. By utilizing AI and digital twins, these platforms provide a granular view of environmental impact, social equity, and governance transparency.
For firms operating in the built environment, the challenge is not a lack of data, but the lack of integrated data. A modern dashboard must synthesize information from sensors, supply chain logs, and financial reports to provide a holistic view of project health. This integration ensures that ESG is not a “side project” but an intrinsic part of the infrastructure lifecycle.
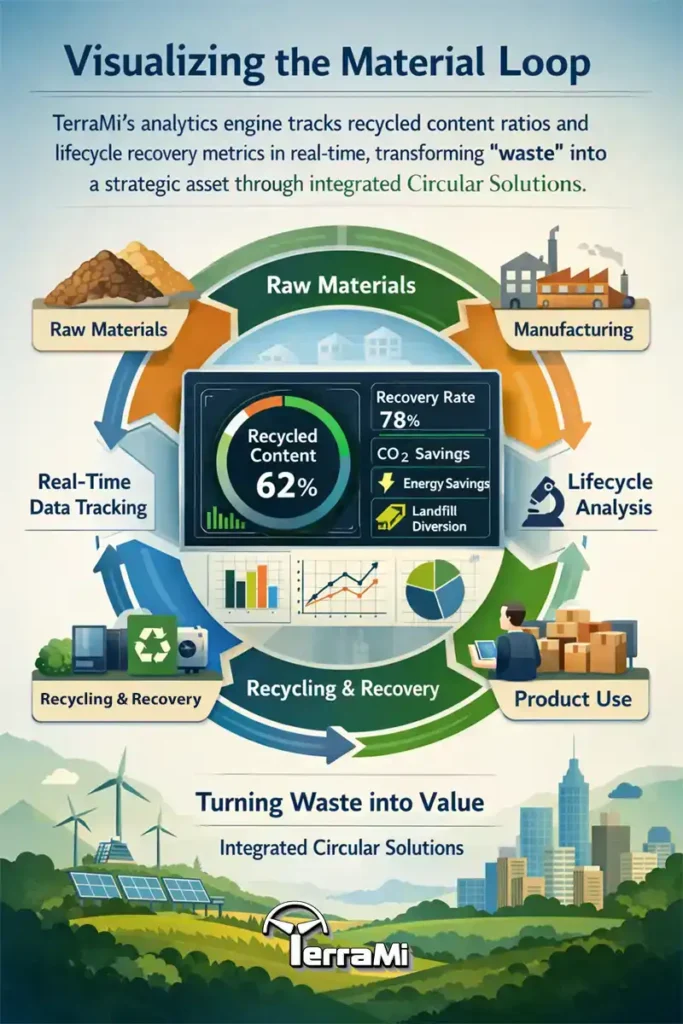
Prioritizing Circular Solutions in Data Tracking
As highlighted in recent strategic refinements, the focus for 2026 must be on Circular Solutions. Linear construction models—take, make, waste—are being replaced by circular frameworks that prioritize resource recovery and material longevity. An effective ESG Performance Dashboard must track:
- Recycled Content Ratios: Monitoring the percentage of diverted waste and recycled aggregates used in new structures.
- Material Passports: Digital records that track the chemical composition and disassembly potential of infrastructure components.
- Lifecycle Carbon Tracking: Measuring the embodied carbon of materials from extraction to end-of-life.
By quantifying these Circular Solutions, organizations can demonstrate tangible progress toward the , making their projects more attractive to green finance investors who demand rigorous evidence of sustainability.
Aligning Metrics with Global Sustainability Goals
Every KPI (Key Performance Indicator) displayed on a dashboard should serve a larger purpose. Management’s recent emphasis on Sustainability Goals ensures that data collection remains purposeful. For example, tracking water usage is only meaningful if it is benchmarked against local water stress levels and the project’s internal reduction targets.
An optimized ESG Performance Dashboard allows for “drill-down” capabilities. A CEO can see the overall carbon footprint of the firm’s portfolio, while a site manager can see the emissions generated by a specific piece of heavy machinery. This transparency fosters a culture of accountability where every team member understands their role in achieving the organization’s ESG mandates.
The Role of AI and Digital Twins
Artificial Intelligence is the engine behind the next generation of reporting. AI algorithms can scan thousands of data points to identify anomalies or predict when a project might deviate from its ESG targets. When paired with Digital Twins—virtual replicas of physical assets—the ESG Performance Dashboard becomes a predictive tool.
- Predictive Analytics: AI can forecast potential social risks or environmental breaches before they occur.
- Automated Reporting: Reducing the administrative burden of ESG compliance by automating data feeds into frameworks like GRI or SASB.
- Scenario Modeling: Testing how different Circular Solutions would impact the overall project footprint before a single stone is laid.

Social and Governance Metrics: The Human Element
While environmental data often takes center stage, the “S” and “G” in ESG are equally critical. A robust ESG Performance Dashboard tracks workforce well-being, safety frequency rates, and diversity metrics. Governance metrics, such as board diversity and anti-corruption training completion, provide the ethical framework necessary for long-term project viability.
Investors are increasingly looking for infrastructure projects that prioritize . Dashboards that display real-time safety data and local hiring percentages provide the social license to operate in complex regulatory environments.
From Policy to Practice: The Final Metric
Ultimately, an ESG Performance Dashboard is only as good as the decisions it inspires. Whether it is choosing a supplier based on their green procurement score or redesigning a bridge to use 30% less steel, the data must lead to action. As regulations tighten globally, having a centralized platform for ESG data is no longer just about leadership—it is about resilience.
By focusing on Sustainability Goals and integrating Circular Solutions, TerraMi continues to set the benchmark for infrastructure intelligence. We provide the tools that allow project owners to measure what really matters, ensuring that the infrastructure of tomorrow is built on the data of today.
Contact Us
For more insights on how to implement specialized data-driven analytics for your next infrastructure project, please visit our page. Our team of experts is ready to help you align your operational reality with your ESG commitments.

Questions and Answers(FAQ)
1. Why are Circular Solutions emphasized in the new ESG dashboards? In modern infrastructure, the linear “extract-use-dispose” model is no longer viable due to resource scarcity and ESG regulations. By tracking Circular Solutions, such as material reuse and lifecycle recovery, firms can significantly reduce waste and lower their Scope 3 emissions, which is a key requirement for attracting green investment.
2. How does an ESG Performance Dashboard prevent “Greenwashing”? Greenwashing occurs when claims are not backed by data. A real-time dashboard provides a “single source of truth” by using verified, automated data feeds rather than manual, curated reports. This transparency ensures that progress toward Sustainability Goals is documented, auditable, and scientifically sound.
3. What is the role of AI in ESG data management for construction? AI processes complex datasets—from sensor logs to procurement invoices—to provide actionable insights. It helps in predictive modeling, allowing managers to see how specific design changes will affect the project’s long-term sustainability performance, thus ensuring the infrastructure is “future-ready.”